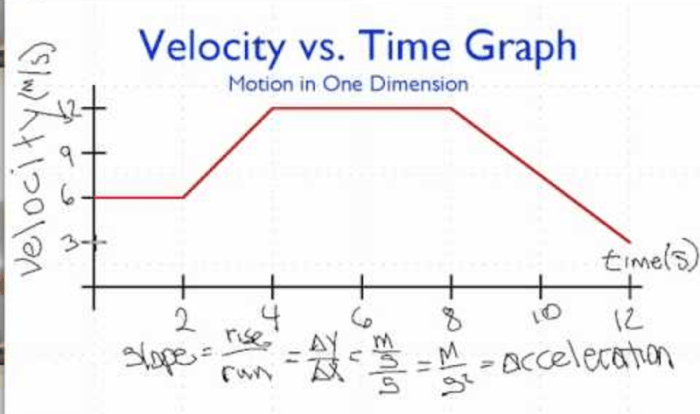
A Venn diagram is a graphic organizer that visually represents the relationships between sets. It is a powerful tool for organizing and comparing information, making it useful in various fields such as mathematics, science, and social studies.
Venn diagrams consist of overlapping circles, where each circle represents a set. The overlapping areas represent the elements that are common to both sets. This simple yet effective visual representation allows for easy identification and analysis of similarities and differences between sets.
A Venn Diagram: A Graphic Organizer for Visualizing Set Relationships

A Venn diagram is a graphic organizer that visually represents the relationships between different sets. It consists of overlapping circles, with each circle representing a set and the overlapping areas representing the elements that are common to both sets.
Key Features of a Venn Diagram
- Circles: Venn diagrams consist of one or more circles, each representing a set.
- Overlapping Areas: The areas where the circles overlap represent the elements that are common to both sets.
- Labels: Each circle is labeled with the name of the set it represents.
Types of Venn Diagrams
- Two-Circle Venn Diagrams: These diagrams are used to compare two sets and show their intersection.
- Three-Circle Venn Diagrams: These diagrams are used to compare three sets and show their intersections and unions.
- Multi-Circle Venn Diagrams: These diagrams can be used to compare more than three sets.
Applications of Venn Diagrams
- Mathematics: Venn diagrams are used to represent set theory concepts and solve problems involving intersections and unions.
- Science: Venn diagrams are used to compare and contrast different scientific concepts, such as the properties of elements or the characteristics of organisms.
- Social Studies: Venn diagrams are used to analyze historical events, compare cultures, and understand social issues.
Creating and Interpreting Venn Diagrams
- Identify the sets: Determine the sets that need to be compared and represented in the diagram.
- Label the circles: Label each circle with the name of the set it represents.
- Shade the overlapping areas: Shade the areas where the circles overlap to represent the elements that are common to both sets.
- Interpret the diagram: Analyze the diagram to understand the relationships between the sets, including the number of elements in each set, the number of elements in the intersection, and the number of elements in the union.
Examples and Illustrations
| Two-Circle Venn Diagram | Three-Circle Venn Diagram |
|---|---|
Advanced Uses of Venn Diagrams
- Comparing Multiple Sets: Venn diagrams can be used to compare more than three sets by creating multiple overlapping circles.
- Representing Complex Relationships: Venn diagrams can be used to represent complex relationships between sets, such as hierarchies or dependencies.
Limitations and Alternatives to Venn Diagrams, A venn diagram is a graphic organizer
- Limitations: Venn diagrams can become difficult to interpret when representing large numbers of sets or complex relationships.
- Alternatives: Other graphic organizers, such as Euler diagrams or Hasse diagrams, can be used to represent more complex relationships between sets.
Query Resolution: A Venn Diagram Is A Graphic Organizer
What is the purpose of a Venn diagram?
A Venn diagram is used to visually represent the relationships between sets, making it easier to identify similarities and differences.
What are the different types of Venn diagrams?
There are different types of Venn diagrams, including two-circle, three-circle, and more complex diagrams. The type of diagram used depends on the number of sets being compared.
How do you create a Venn diagram?
To create a Venn diagram, first identify the sets to be compared. Then, draw circles to represent each set. Overlap the circles to represent the elements that are common to both sets.